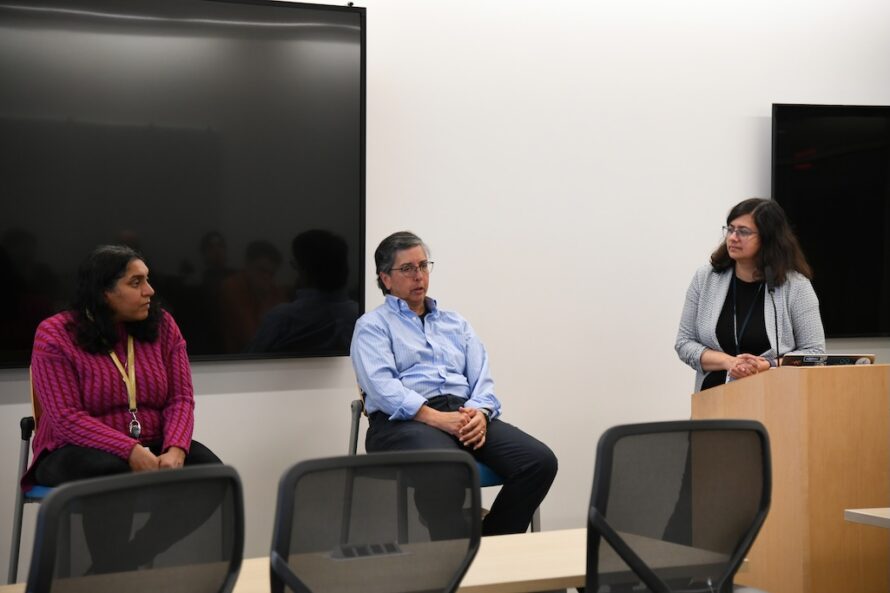
SciData Workshop Brings Community Together To Reflect, Collaborate, And Look Ahead
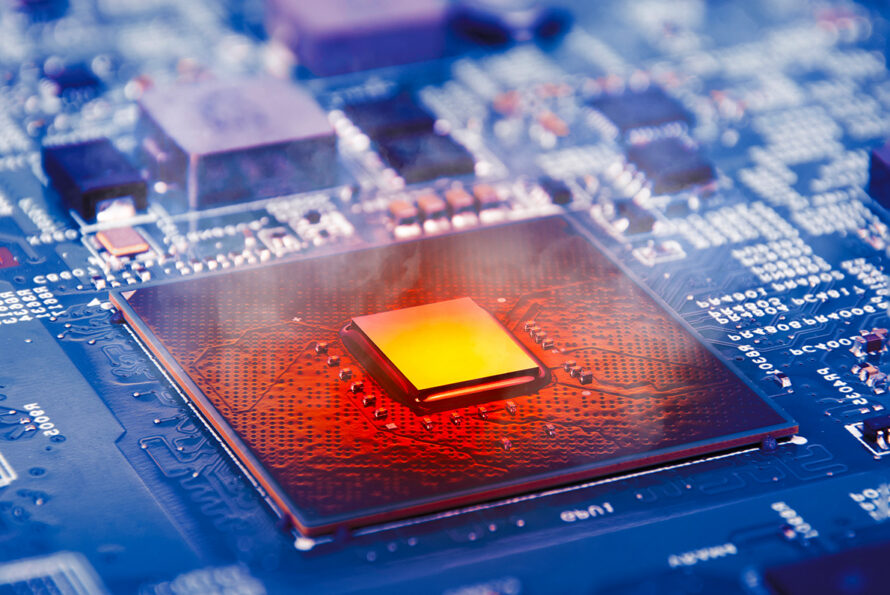
Thermodynamic Computing Advances with Design and Training
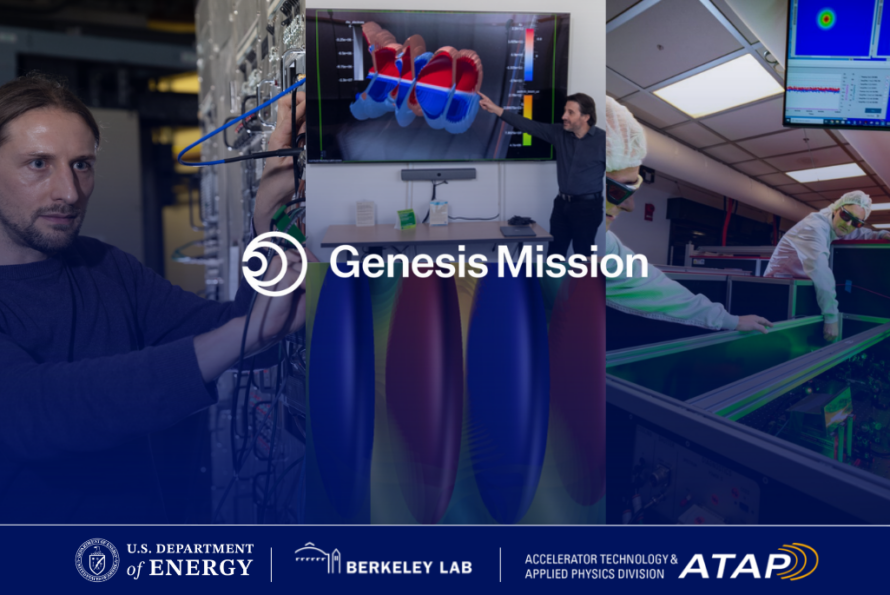
Harnessing AI for Particle Accelerator Innovation
Find out about the latest research announcements, learn about key people, and get the low down on CSA happenings and events in CSA’s monthly newsletter, InTheLoop.
CS Week, 2025 Quarter 1
Mark your calendars and make plans to join the CS Area in person for a three-day summit of events, activities, and workshops. The next CS Week will be held February 4 – 6, 2025.
The CS Week website is your source for event details for each day, travel information for remote employees, and valuable information for first-timers.
Postdoc Symposium
The next Postdoc Symposium will take place on Tuesday, February 4, 2025.
Summer Student Program
It’s not too early to get excited for summer! Applications for summer interns are open now. Follow the link to learn more and apply.
Last edited: March 13, 2025