
Berkeley Lab Researchers Share Expertise at SIAM’s CSE23
The Most Advanced Bay Area Earthquake Simulations Will be Publicly Available

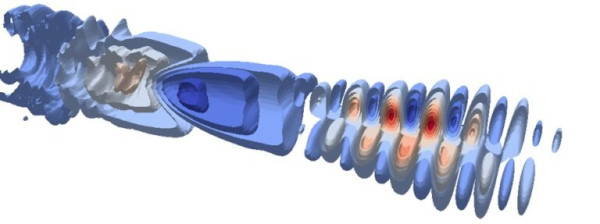
WarpX Code Shines at the Exascale Level
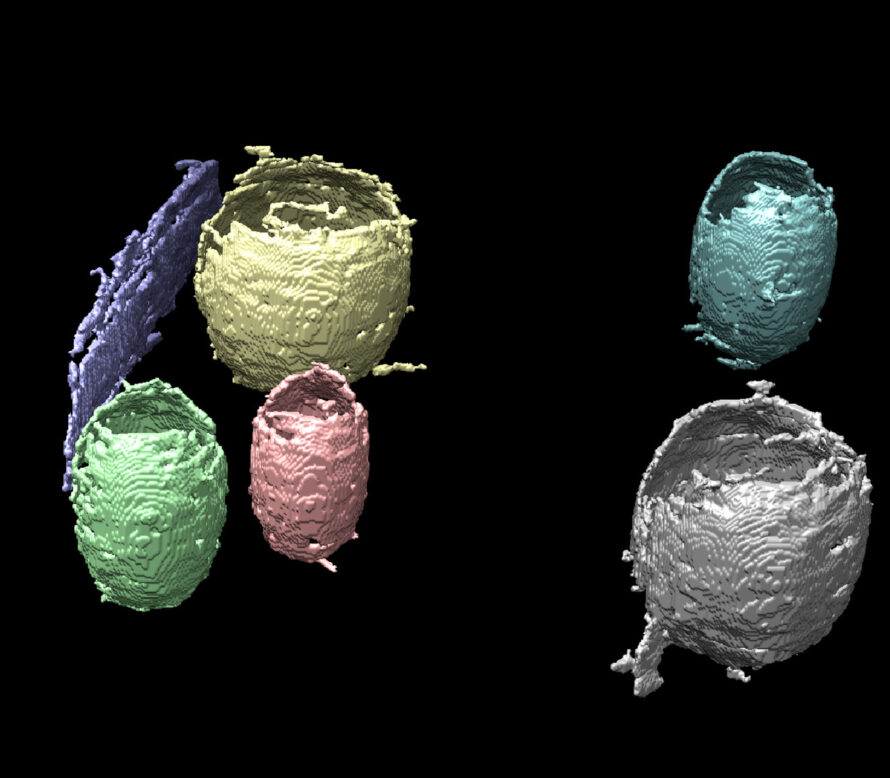
Berkeley Lab Scientists Create Machine Learning Pipeline for Interpreting Large Tomography Datasets
Berkeley Lab’s Ushizima Honored with PMWC Pioneer Award
Perlmutter Results Show Progress in Quantum Information Science

New Search Method Expands Horizon in Hunt for New Polymer Electrolytes

The SciData Division’s Jean Luca Bez Receives BSSw Honorable Mention

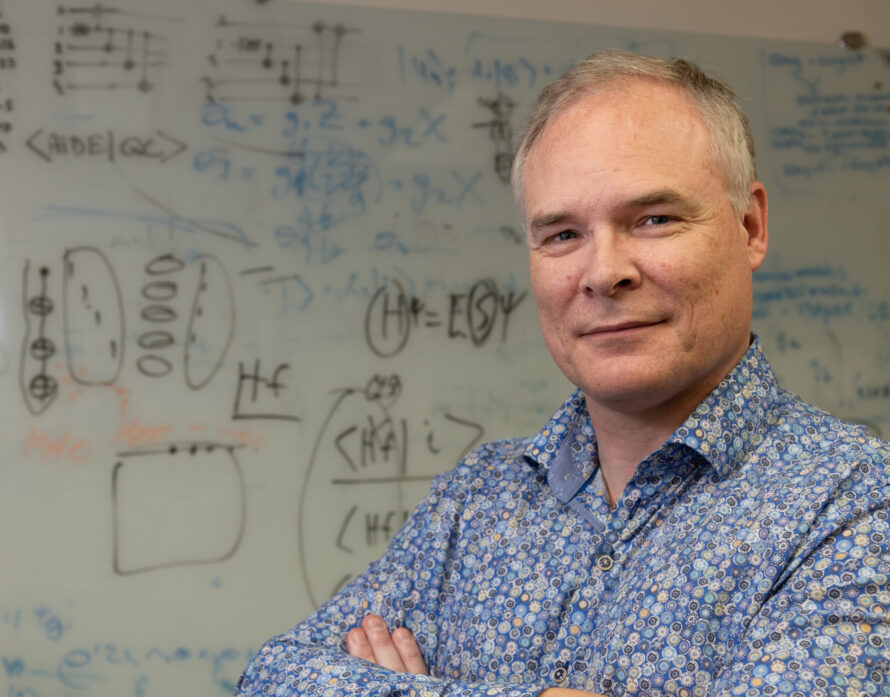
Bert de Jong Named 2023 Oppenheimer Science and Energy Leadership Program Fellow
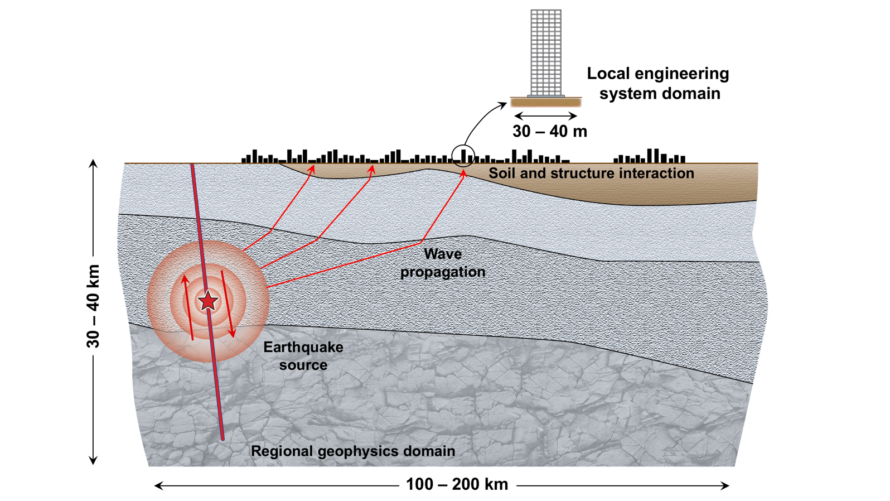
EQSIM Shakes Up Earthquake Research at the Exascale Level
SC22 Recap: For Berkeley Lab, a Gordon Bell Prize Win and More
CS Staff to Present at 2022 American Geophysical Union Meeting