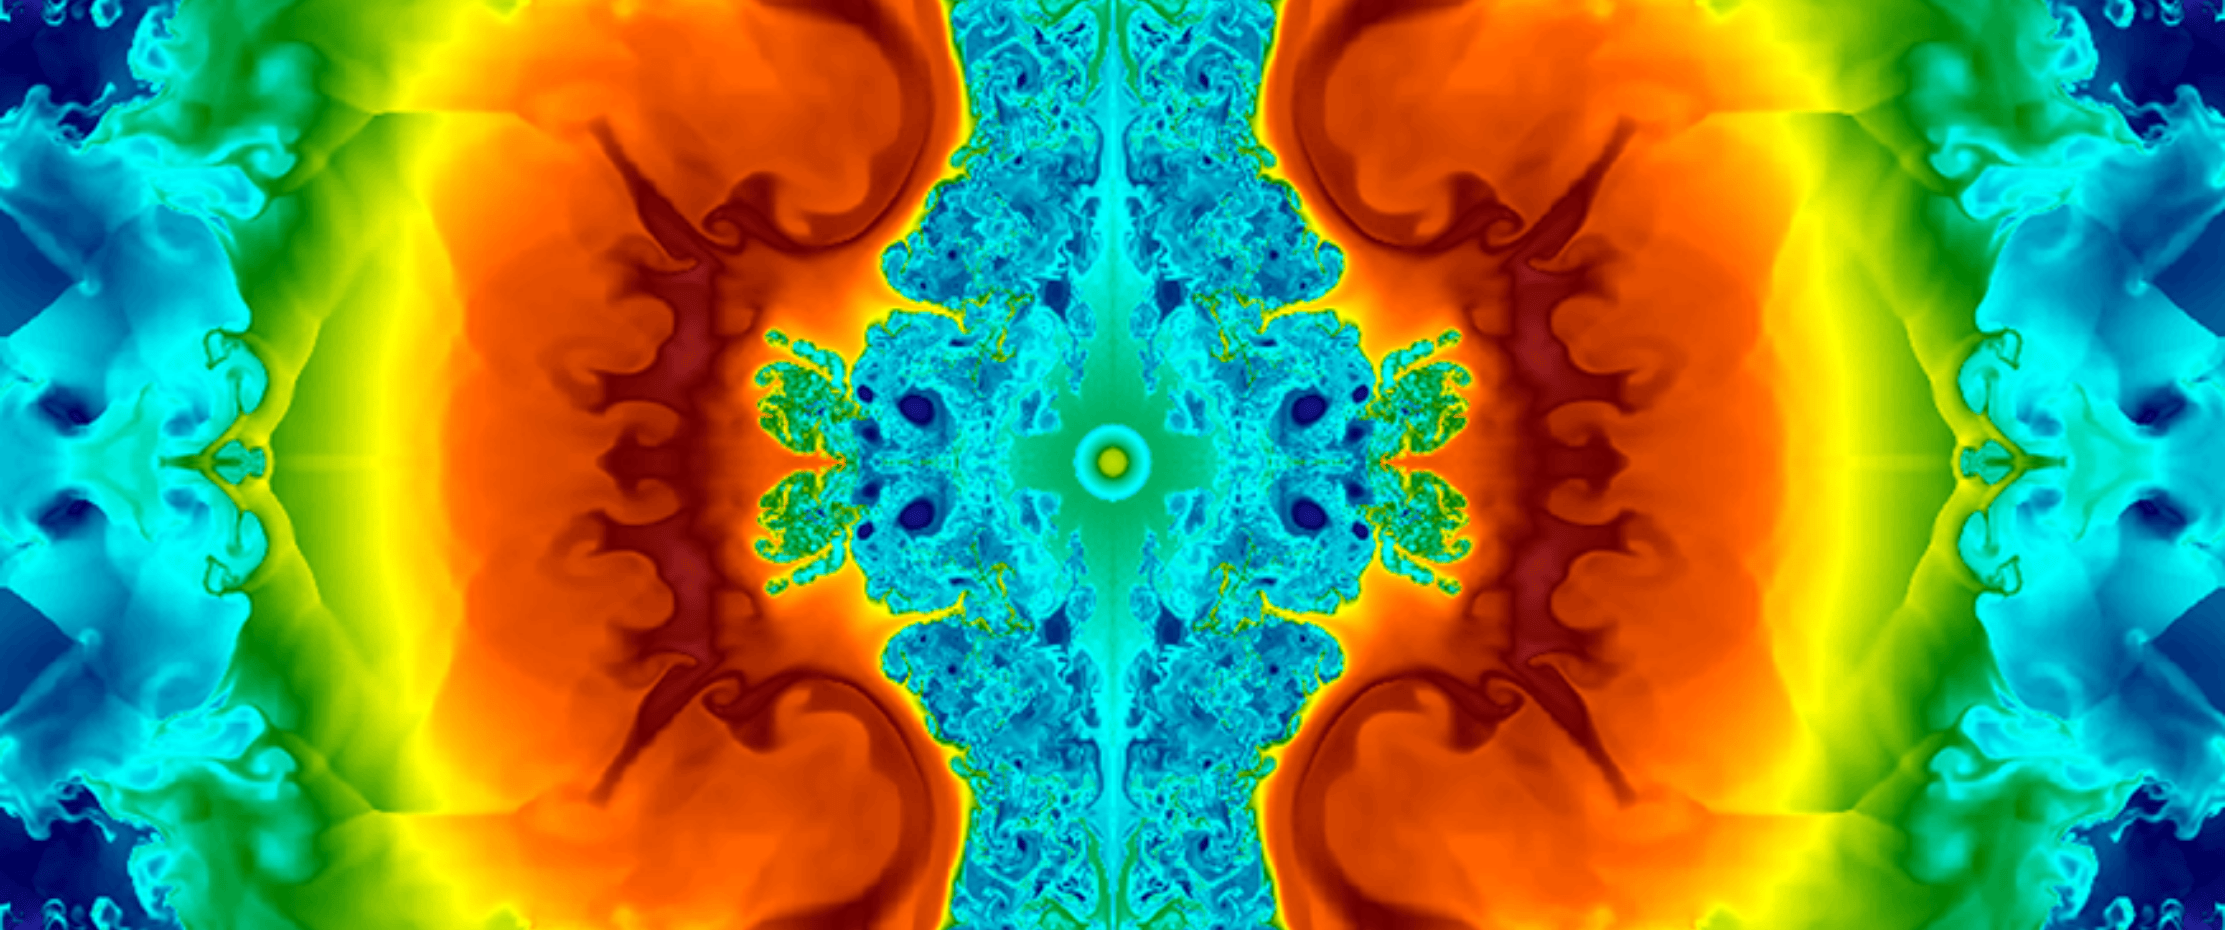
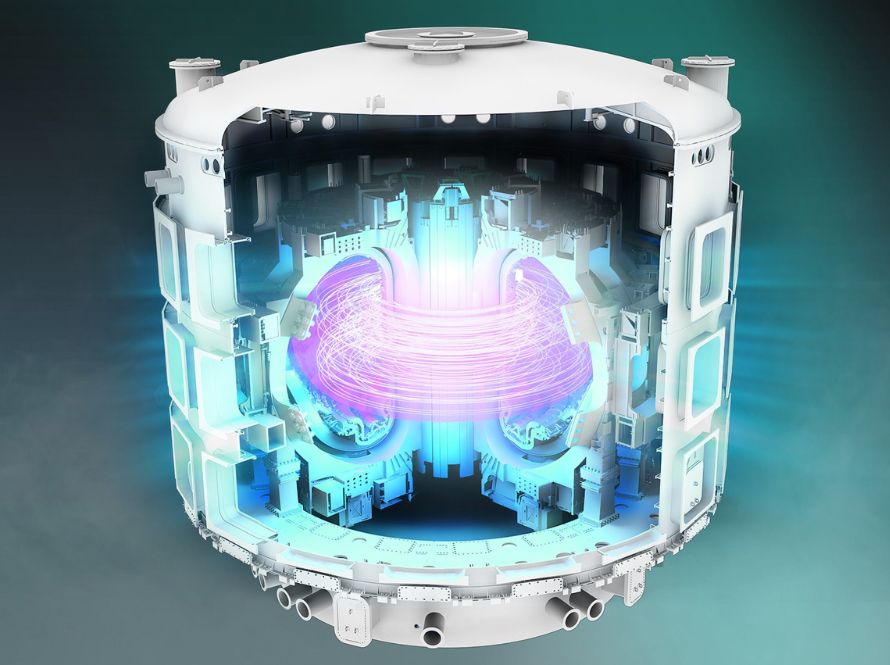
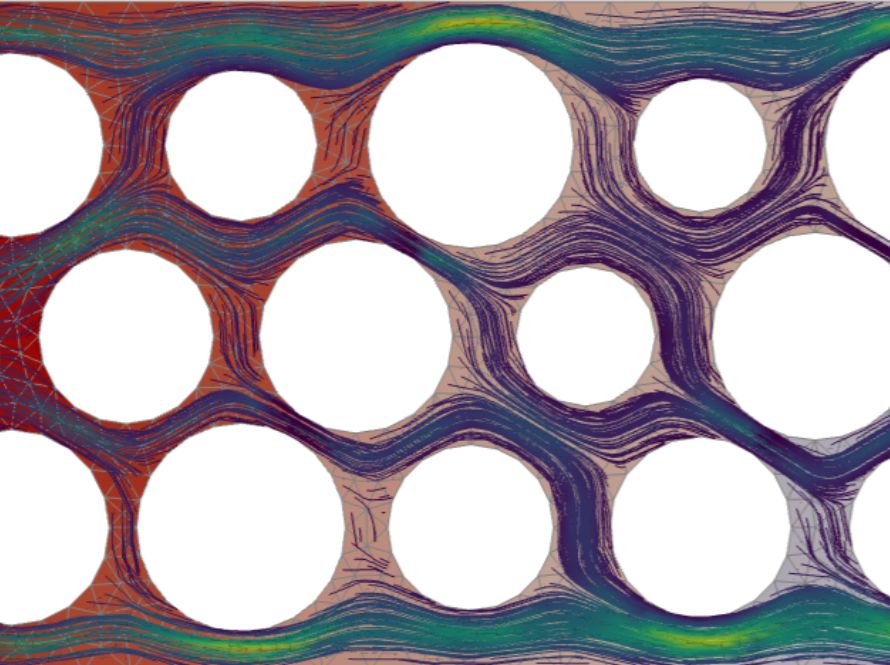
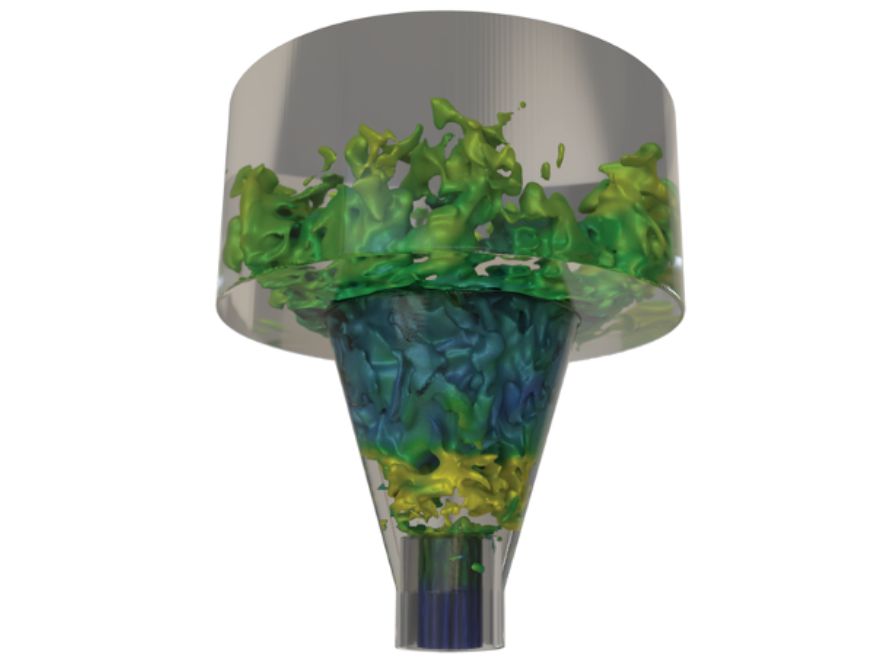
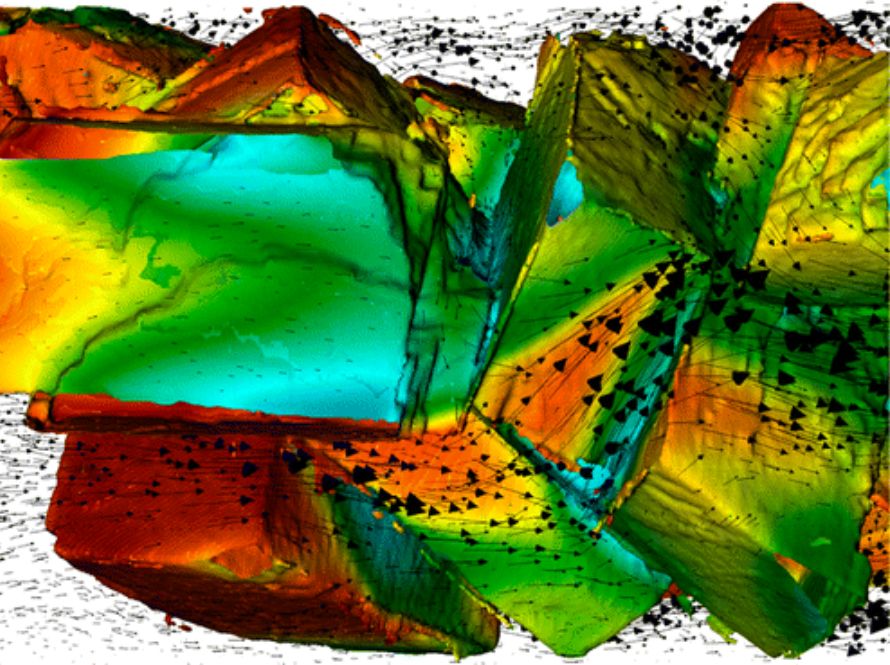
Applied mathematics involves using mathematical approaches and techniques to solve real-world problems in specialized fields such as physics, biology, computer science, and engineering. Researchers apply mathematical methods to model and simulate physical phenomena—such as fluid flows, electromagnetic devices, materials, future energy, and quantum materials—analyze experimental data and develop innovative machine-learning techniques.
At Berkeley Lab, our mathematics work is highly collaborative. Our applied mathematicians and computer scientists partner with scientists nationwide to design and develop mathematical models and algorithms that address scientific and engineering challenges of interest to the Department of Energy, particularly in the areas of energy and the environment.
We create novel numerical methods to solve mathematical problems more quickly, accurately, and efficiently. Our team develops widely used open-source software for efficient simulations, machine learning strategies, and mathematical approaches for experimental investigations, advancing scientific discovery through collaboration.
Our experts excel in analyzing and solving nonlinear partial differential equations, ordinary differential equations, and stochastic processes. Additionally, our numerical linear algebra specialists develop efficient linear and eigensolver algorithms, along with scalable library implementations. Most of our algorithms are optimized for current and next-generation massively parallel computing architectures.
Our Research Pillars:
- Discretizations & Methods
- Interface Dynamics
- Numerical Linear Algebra
- Math for Data
- Mathematical Software
- Optimization
- Partial Differential Equations
- Uncertainty Quantification
SuperLU
SuperLU is an open-source library for the direct solution of large, sparse linear systems, providing robust and scalable algorithms essential for high-performance scientific computing and simulation at extreme scales.
STRUMPACK
STRUMPACK (STRUctured Matrices PACKage) delivers advanced algorithms for solving large sparse and dense linear systems, leveraging hierarchical matrix compression for exceptional speed and memory efficiency on modern supercomputers.
PETSc
PETSc (the Portable, Extensible Toolkit for Scientific Computation) is a suite of data structures and routines for scalable parallel solution of scientific applications modeled by partial differential equations and related problems.
AMReX
AMReX is a modern, open-source framework for block-structured adaptive mesh refinement (AMR), designed for exascale computing and next-generation architectures. It enables high-performance, massively parallel simulations of multiscale and multiphysics phenomena in cutting-edge scientific applications.
Chombo
Chombo is a robust and flexible AMR framework supporting complex geometries and embedded boundaries, widely used for developing parallel simulation codes in fluid dynamics, plasma physics, and geosciences. It is valued for its extensibility and its support of legacy and industrial applications.
Roofline Model
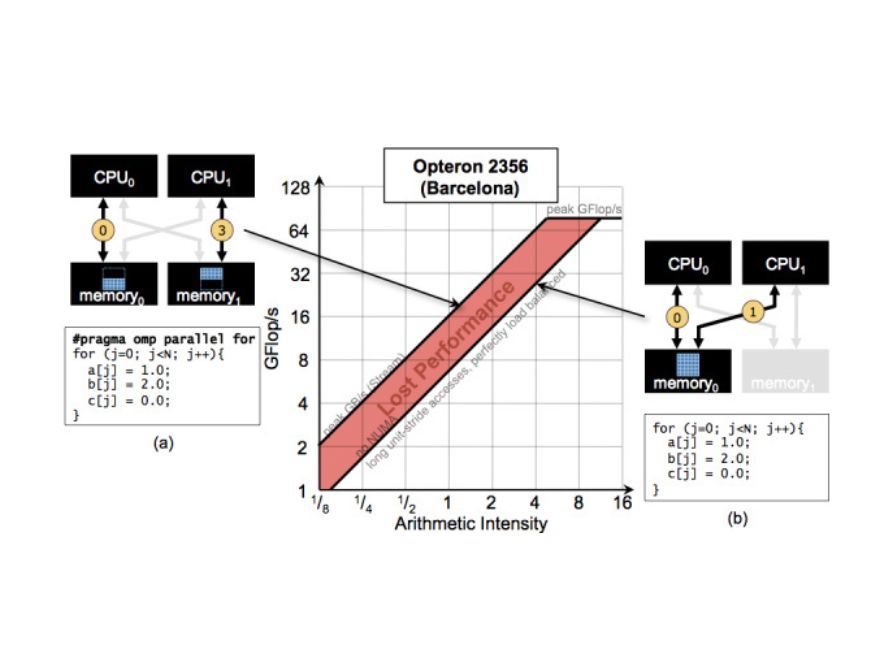
The Roofline Model offers an intuitive visual and mathematical framework for analyzing and optimizing code performance on multicore and accelerator-based supercomputers, helping researchers identify and overcome computational bottlenecks.
CAMERA
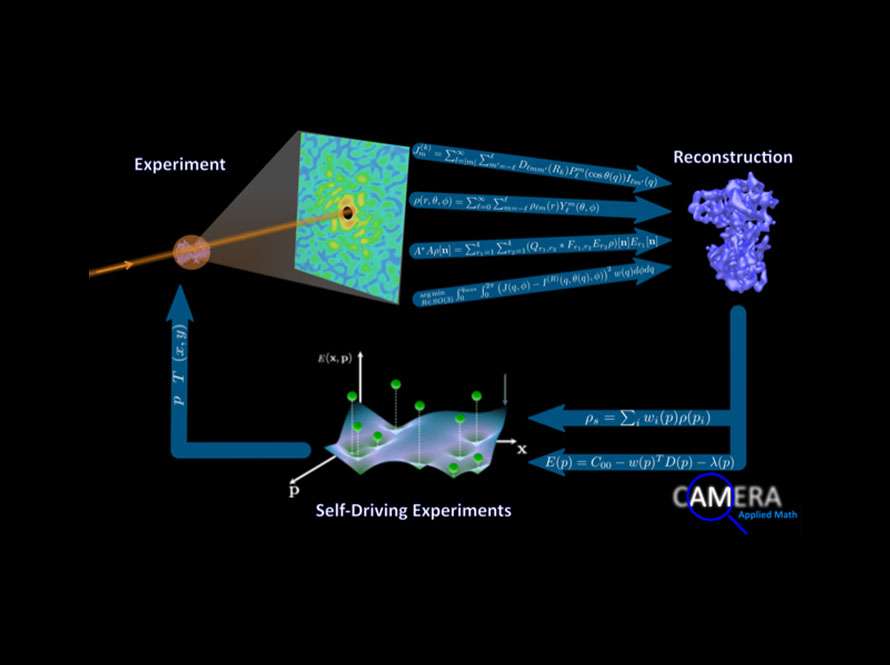
CAMERA invents, develops, and delivers new mathematics for experimental data analysis, imaging, and autonomous experiments, accelerating discovery at national user facilities through advanced algorithms and cross-disciplinary collaboration.
gpCAM
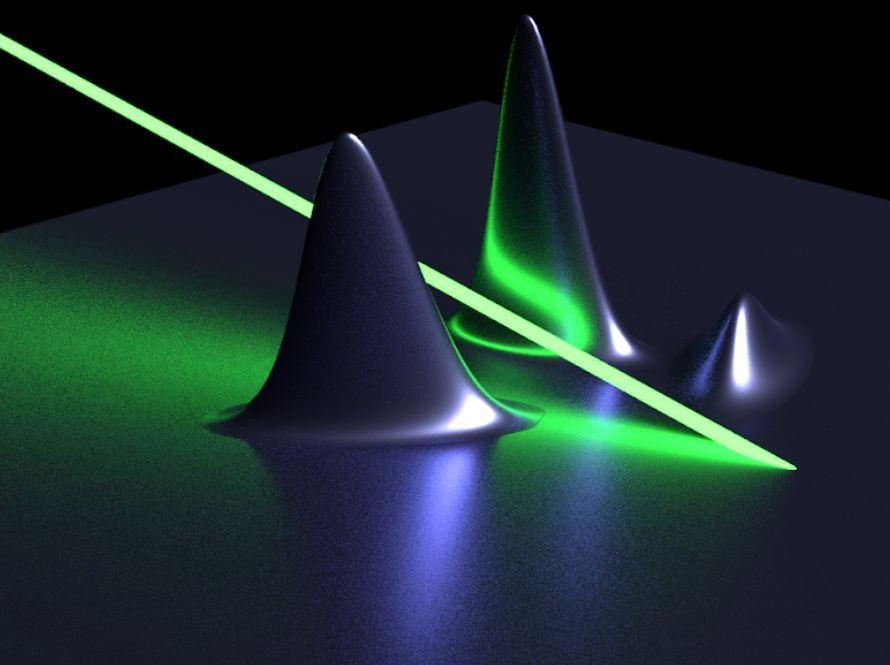
gpCAM brings advanced mathematics to autonomous experimentation, using Bayesian optimization and machine learning to guide scientific instruments in real time. By mathematically modeling uncertainty and efficiently exploring complex possibilities, gpCAM enables “self-driving” labs that accelerate discovery and make experiments smarter and more efficient.
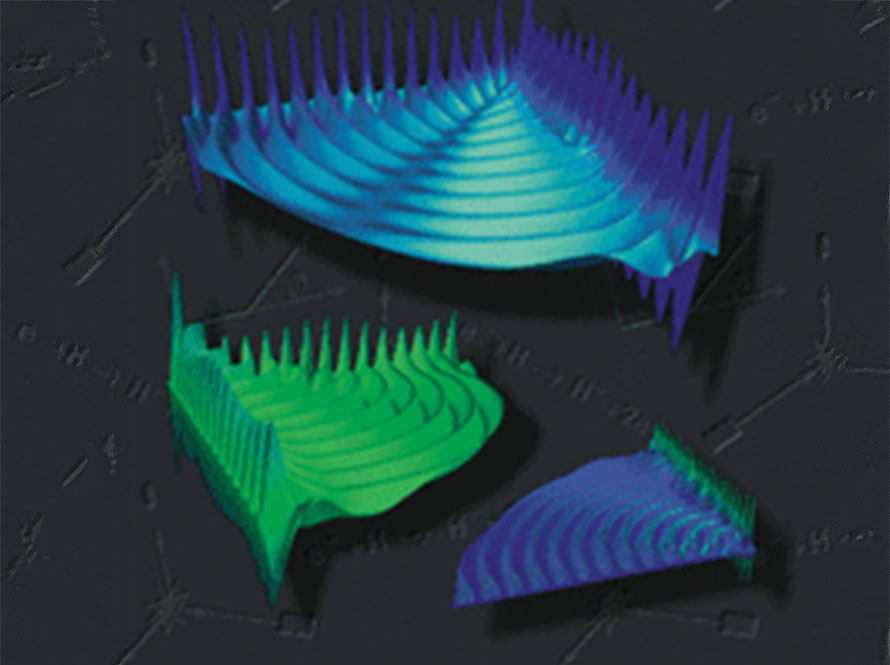
BerkeleyGW
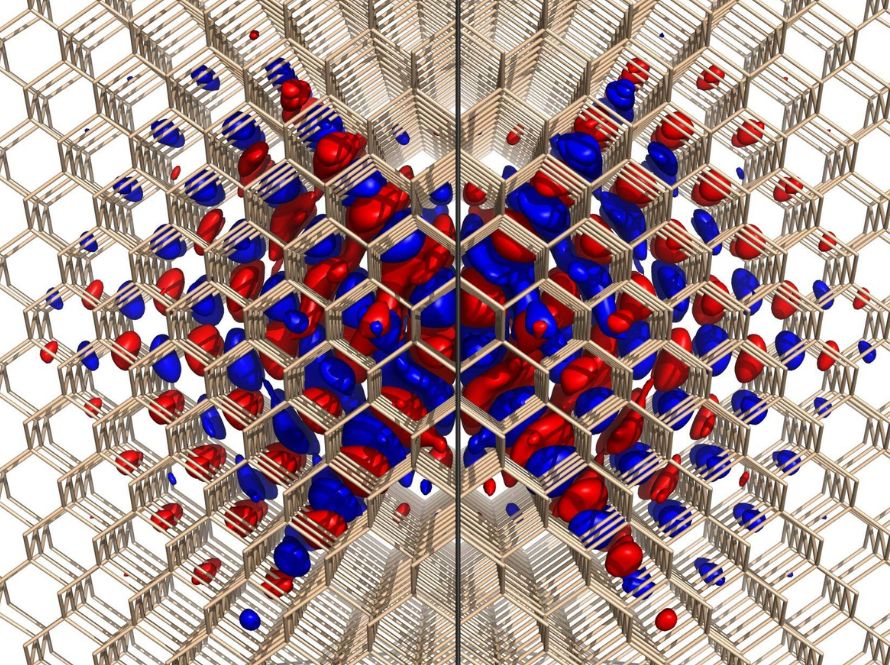
BerkeleyGW applies cutting-edge mathematical methods to solve quantum mechanical equations, allowing scientists to accurately predict the electronic and optical properties of new materials. This mathematical rigor accelerates innovation in energy, nanotechnology, and computing.
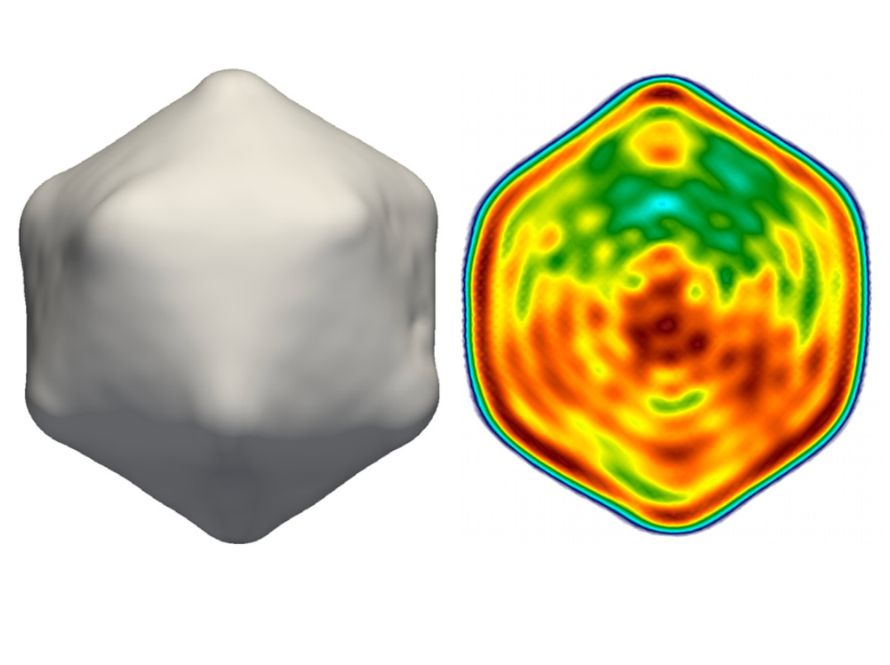
HipGISAXS
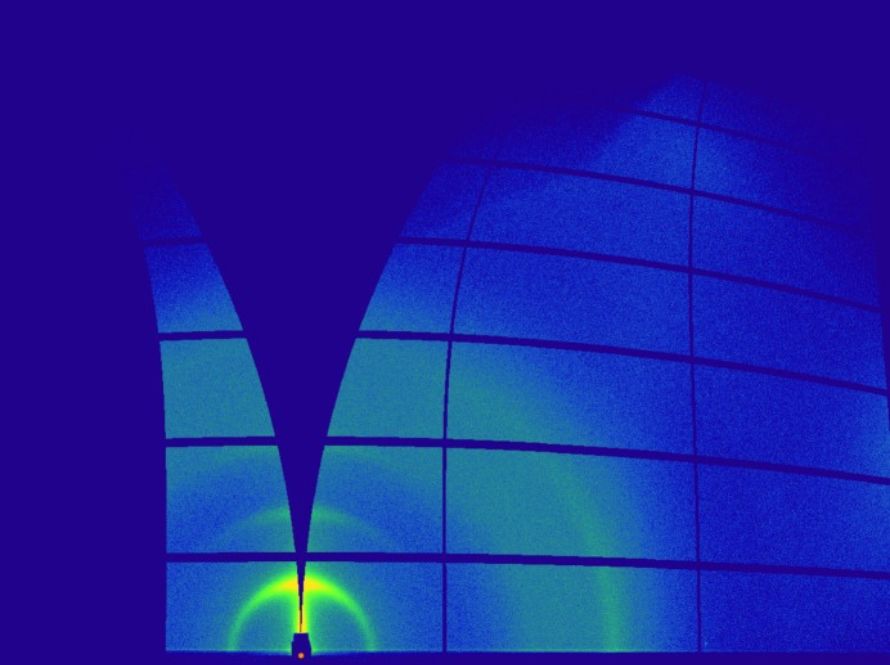
HipGISAXS uses powerful mathematical algorithms and high-performance computing to analyze X-ray scattering data, revealing the nanoscale structure of advanced materials. Its mathematical foundations help researchers unlock new insights for batteries, catalysts, and medical technologies.
Xi-cam
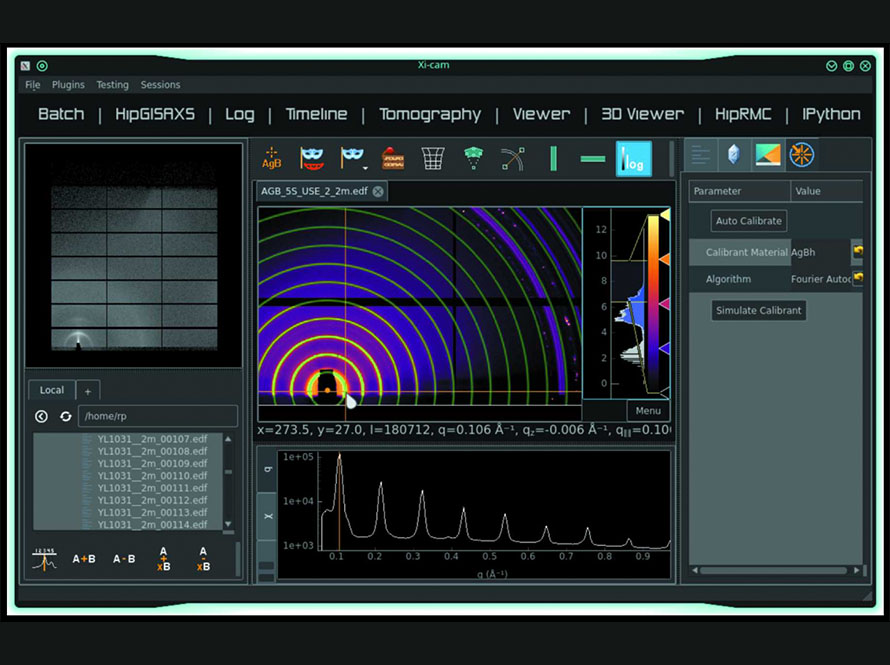
Xi-cam integrates advanced mathematical techniques into user-friendly software that visualizes and interprets complex experimental data from leading research facilities. This mathematical sophistication enables scientists to draw meaningful conclusions from massive, high-throughput datasets.
ENDURABLE

ENDURABLE brings mathematical precision to organizing and sharing scientific data for AI and machine learning, developing robust standards and tools that ensure data quality and reproducibility. Its approach empowers researchers to build trustworthy, data-driven scientific discoveries.
Mathematics Group
AMCR Mathematics Research
Math for Experimental Data Group