
News

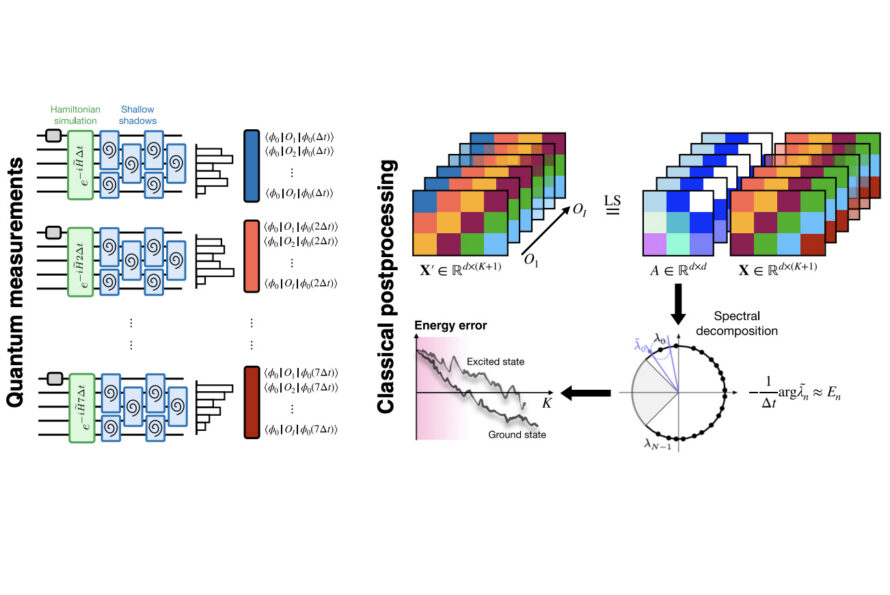
New Hybrid Approach Bypasses Hardware Limits to Unlock Complex Quantum Simulations

A schematic diagram divided into two main sections illustrating a computational workflow, with Quantum measurements on the left and Classical postprocessing on the right. The left section displays a series of quantum circuit diagrams at increasing time steps, featuring green blocks labeled Hamiltonian simulation and blue blocks labeled Shallow shadows, which output histograms and color-coded data vectors. The right section shows the flow of classical data processing, starting at the top with multi-layered, colorful grids representing data matrices being used to compute a central system matrix. An arrow points down from this matrix to a diagram labeled Spectral decomposition, which shows data points plotted around the perimeter of a circle to represent eigenvalues. A final arrow points left to a line graph labeled Energy error, illustrating the error rates for both an excited state and a ground state steadily decreasing as the number of data points increases.

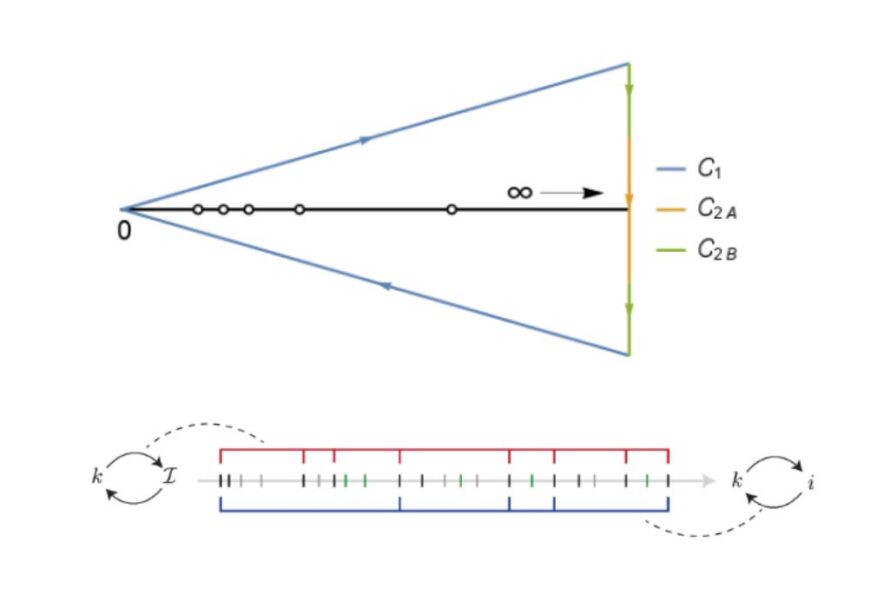
Mathematical Innovation Advances Complex Simulations for Science’s Toughest Problems

A two-part diagram illustrating a mathematical framework for simplifying complex models. The top diagram shows a V-shaped path of blue arrows enclosing a horizontal line that extends from a point labeled '0' towards an infinity symbol. Small circles along the line represent key numbers describing a system's dynamics. The blue path illustrates a calculation where orange and green segments at the far right can be ignored, allowing scientists to focus on the system's essential features for faster results. The bottom diagram shows a horizontal line with colored tick marks representing a random process visiting different states over time. Above the line, red brackets group larger sets of states into repeating loops, or cycles. Below the line, blue brackets highlight more specific cycles. This illustrates how analyzing these cycles can simplify and speed up complex simulations.

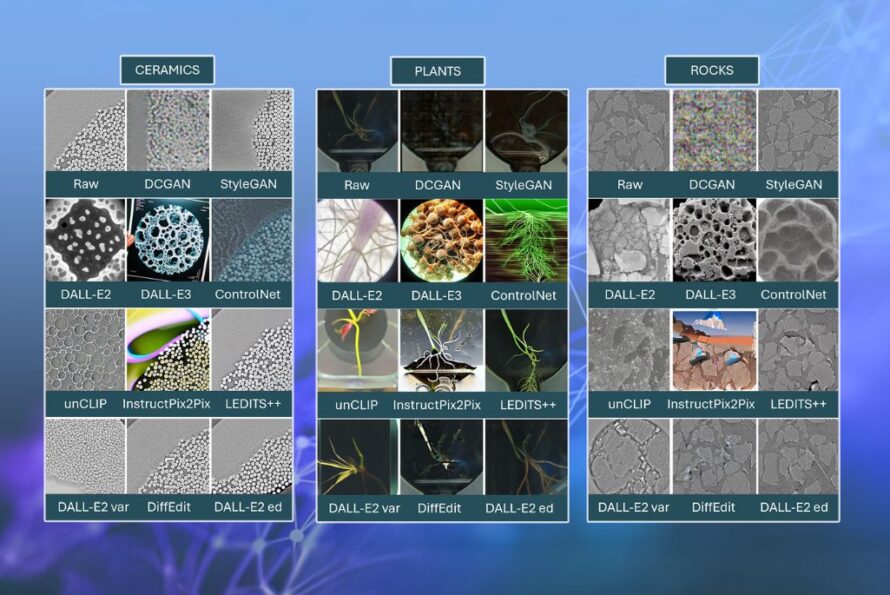
Berkeley Lab Researchers Evaluate Generative AI Models for Filling Scientific Imaging Gaps

A comparative infographic showcasing the results of different generative AI models in creating scientific images. The infographic is divided into three vertical sections, labeled 'Ceramics,' 'Plants,' and 'Rocks.' Each section contains a grid of images comparing a 'Raw' scientific source image to AI-generated versions created by models including DCGAN, StyleGAN, DALL-E2, and DALL-E3. The 'Ceramics' section shows microscopic views of packed particles, the 'Plants' section displays images of seedlings and root systems, and the 'Rocks' section features grayscale micro-scans of rock sediment, illustrating the varying success of different AI models in reproducing scientifically accurate images.

Unprecedented Perlmutter Simulation Details Quantum Chip

Computing Sciences logo