New Hybrid Approach Bypasses Hardware Limits to Unlock Complex Quantum Simulations
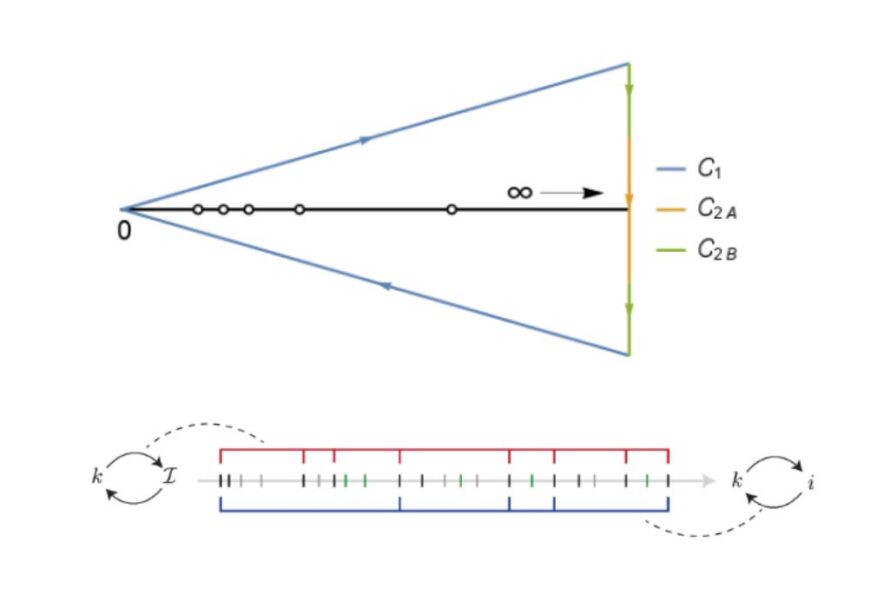
Mathematical Innovation Advances Complex Simulations for Science’s Toughest Problems
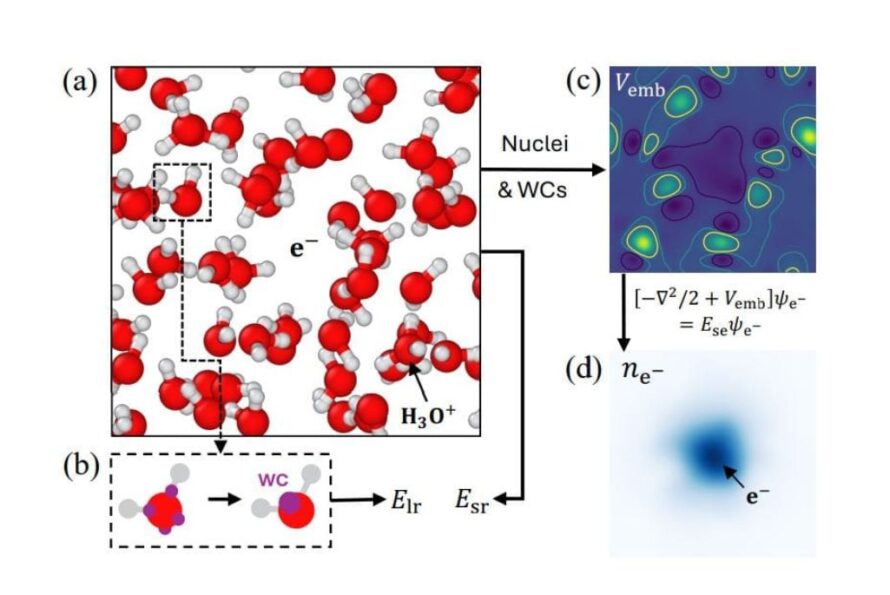
New AI-Powered Hybrid Simulation Reveals How Electrons Drive Chemical Reactions in Liquids
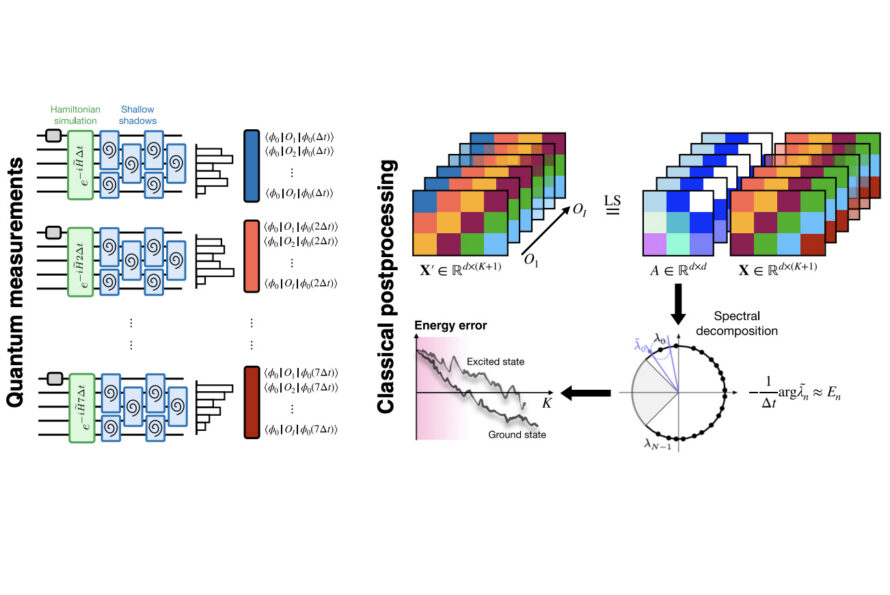
Unlocking the Power of Quantum Computing with Practical Benchmarking Tools

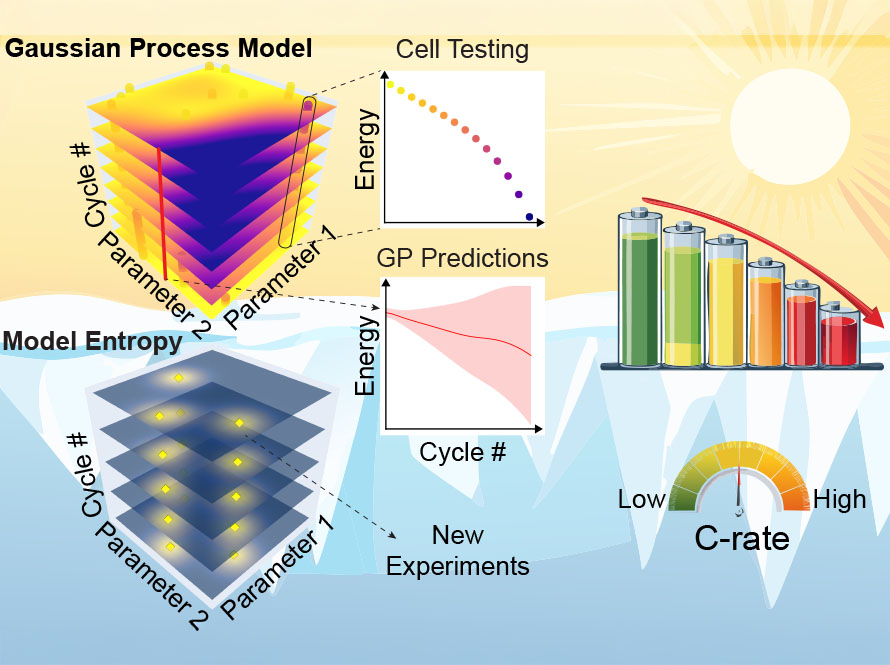
Machine Learning Breakthrough Transforms Battery Lifespan Prediction
Science Highlight: Breakthrough Computing Method Speeds Up Big Calculations for Science and Engineering