


 Instagram
 YouTube
Seeing the Web of Microbes
New Web-based Tool Hosted at NERSC Helps Visualize Exometabolomic Data
March 4, 2019
By Jennifer Huber
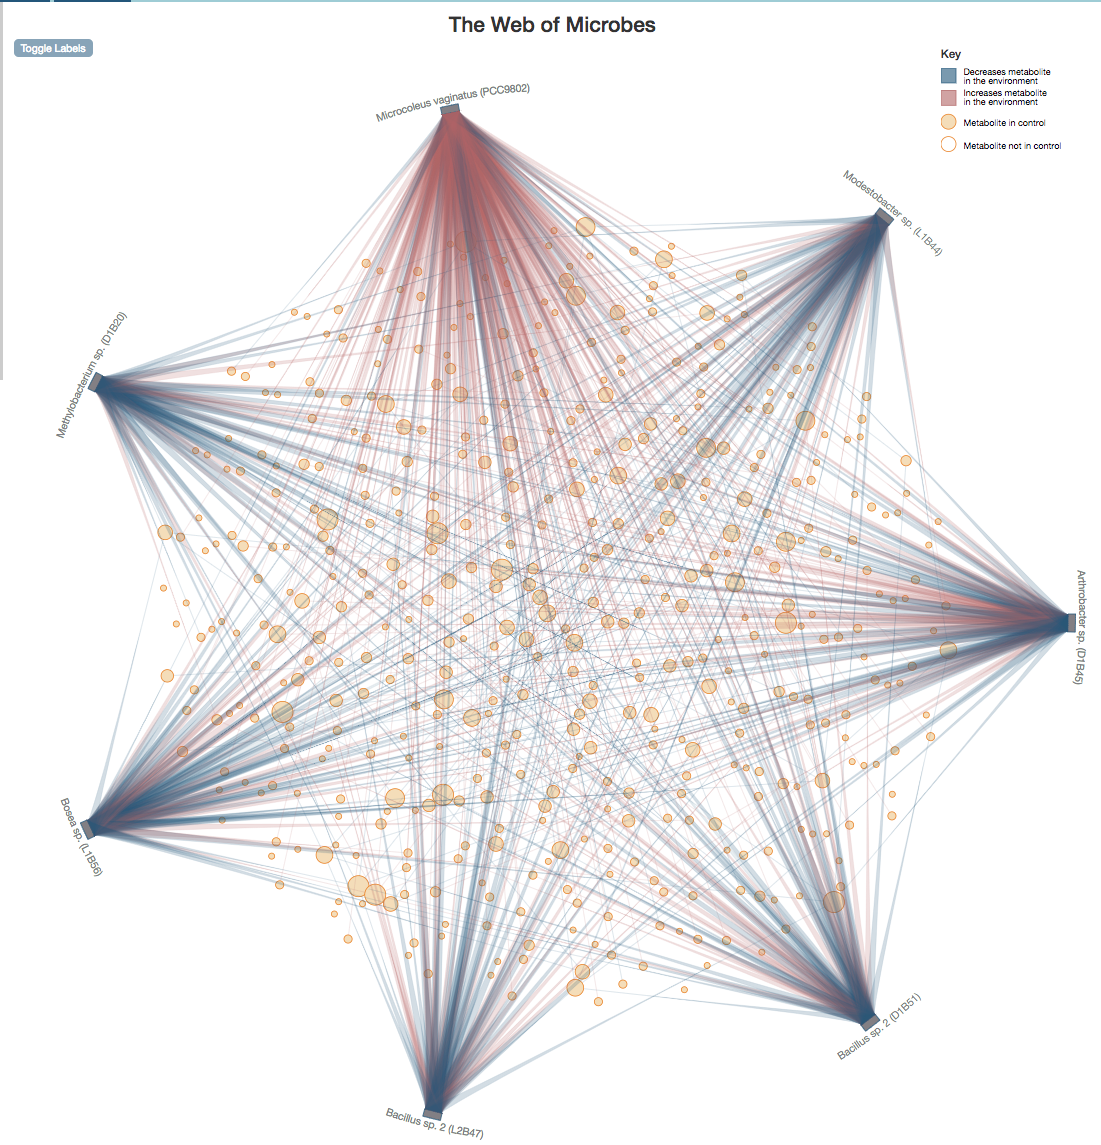
WoM The Web: Microcoleus vaginatus and six heterotrophic biocrust isolates in M. vaginatus extract. The metabolite composition of the control medium is represented by the solid tan circles. Hollow circles are metabolites that were only identified after microbial transformation (indicating production/release by at least one of the organisms and not initially present in the control medium). Connecting lines indicate an increase (red) or decrease (blue) in the metabolite level in the spent medium compared to the control.
Understanding nutrient flows within microbial communities is important to a wide range of fields, including medicine, bioremediation, carbon sequestration, and sustainable biofuel development. Now, researchers from Lawrence Berkeley National Laboratory (Berkeley Lab) have built an interactive, web-based data visualization tool to observe how organisms transform their environments through the increase and decrease of metabolites — enabling scientists to quickly see patterns in microbial food webs.
This visualization tool — the first of its kind — is a key part of a new data repository, the Web of Microbes (WoM) that contains liquid chromatography mass spectrometry datasets from the Northen Metabolomics Lab located at the U.S. Department of Energy’s Joint Genome Institute (JGI). The Web of Microbes project is an interdisciplinary collaboration between biologists and computational researchers at Berkeley Lab and the National Energy Research Scientific Computing Center (NERSC). JGI and NERSC are both DOE Office of Science user facilities.
“While most existing databases focus on metabolic pathways or identifications, the Web of Microbes is unique in displaying information on which metabolites are consumed or released by an organism in an environment such as soil,” said Suzanne Kosina, a senior research associate in Berkeley Lab’s Environmental Genomics & Systems Biology (EGSB) Division, a member of the DOE ENIGMA Scientific Focus Area, and lead author on a paper describing WoM published in BMC Microbiology. “We call them exometabolites since they are outside of the cell. Knowing which exometabolites a microbe ‘eats’ and produces can help us determine which microbes might benefit from growing together or which might compete with each other for nutrients.”
Four Different Viewpoints
WoM is a Python application built on the Django web development framework. It is served from a self-contained Python environment on the NERSC global filesystem by an Apache web server. Visualizations are created with JavaScript, cascading style sheets, and the D3 JavaScript visualization library.
Four different viewing methods are available by selecting the tabs labeled “The Web,” “One Environment,” “One Organism,” and “One Metabolite.” “The Web” view graphically displays data constrained by the selection of an environment, while the other three tabs display tabular data from three constrainable dimensions: environment, organism, and metabolite.
“You can think of the 3D datasets as a data cube,” said NERSC engineer Annette Greiner, second author on the BMC Microbiology paper. “The visualization tool allows you to slice the data cube in any direction. And each of these slices gives one of the 2D views: One Environment, One Organism, or One Metabolite.”
The most intuitive way to view the data is via The Web, which displays an overview of connections between organisms and the nutrients they act on within a selected environment. After choosing the environment from a pull-down menu, The Web provides a network diagram in which each organism is represented as a little box, each metabolite as a circle, and their interactions as connecting lines. The size of the circle scales with the number of organisms that interact with that metabolite, whereas the color and shade of the connecting line indicate the amount of increase (red) or decrease (blue) in the metabolite level due to the microbial activation.
“Having a lot more connecting lines indicates there’s more going on in terms of metabolism with those compounds in the environment. You can clearly see differences in behavior between the organisms,” Greiner said. “For instance, an organism with a dense number of red lines indicates that it produces many metabolites.”
Although The Web view gives users a useful qualitative assessment of metabolite interaction patterns, the other three tabular views provide more detailed information.
The One Environment view addresses to what extent the organisms in a single environment compete or coexist with each other. The heatmap table below shows which metabolites (shown in rows) are removed or added to the environment by each of the organisms (shown in columns), where the color of each table cell indicates the amount of metabolic increase or decrease. And icons identify whether pairs of organisms compete (X) or are compatible (interlocking rings) for a given metabolite.

This WoM heatmap table shows which metabolites (shown in rows) are removed or added to the environment by each of the organisms (shown in columns), where the color of each table cell indicates the amount of metabolic increase or decrease.
“For example, if you’re trying to design a bioreactor and you want to know which organisms would probably work well together in the same environment, then you can look for things with interlocking rings and try to avoid the Xs,” said Greiner.
Similarly, the One Organism heatmap table allows users to compare the actions of a single microbe on many metabolites across multiple environments. And users can use the One Metabolite table to compare the actions of multiple organisms on a selected metabolite in multiple environments.
“Ultimately, WoM provides a means for improving our understanding of microbial communities,” said Trent Northen, a scientist at JGI and in Berkeley Lab’s EGSB Division and also a member of the DOE ENIGMA Scientific Focus Area. “The data and visualization tools help us predict and test microbial interactions with each other and their environment.”
Participatory Design
The WoM tools were developed iteratively using a participatory design process, where research scientists from Northen’s lab worked directly with Greiner to identify needs and quickly try out solutions. This differed from the more traditional approach in which Greiner completes a coherent design for the user interface before showing it to the scientists.
Both Greiner and Kosina agreed that collaborating together was fun and productive. “Instead of going off to a corner alone trying to come up with something, it’s useful to have a user sitting on my shoulder giving me feedback in real time,” said Greiner. “Scientists often have a strong idea about what they need to see, so it pays to have frequent interactions and to work side by side.”
In addition to contributing Greiner’s expertise in data visualization and web application development, NERSC hosts WoM and stores the data. NERSC’s computing resources and well-established science gateway infrastructure should enable WoM to grow both in volume and features in a stable and reliable environment, the development team noted in the BMC Microbiology paper.
According to Greiner, the data itself doesn’t take up much storage space but that may change. Currently, only Northen’s group can upload data but the team hopes to support multiple user groups in the future. For now, the Berkeley Lab researchers are excited to share their data on the Web of Microbes where it can be used by scientists all over the world. And they plan to add more data to the repository as they perform new experiments.
Kosina said it also made sense to work with NERSC on the Web of Microbes project because the Northen metabolomics lab relies on many other tools and resources at NERSC. “We already store all of our mass spectrometry data at NERSC and run our analysis software on their computing systems,” Kosina said.
Eventually, the team plans to link the Web of Microbes exometabolomics data to mass spectrometry and genomics databases such as JGI’s Genome Portal. They are also working with the DOE Systems Biology Knowledgebase (KBase) to allow users to take advantage of KBase’s predictive modeling capabilities, Northen added, which will enable researchers to determine the functions of unknown genes and predict microbial interactions.
Jennifer Huber is a freelance science writer and science-writing instructor. Her work has appeared in KQED Science, Berkeley Engineer and Scope, among other publications.
About Computing Sciences at Berkeley Lab
High performance computing plays a critical role in scientific discovery. Researchers increasingly rely on advances in computer science, mathematics, computational science, data science, and large-scale computing and networking to increase our understanding of ourselves, our planet, and our universe. Berkeley Lab’s Computing Sciences Area researches, develops, and deploys new foundations, tools, and technologies to meet these needs and to advance research across a broad range of scientific disciplines.