
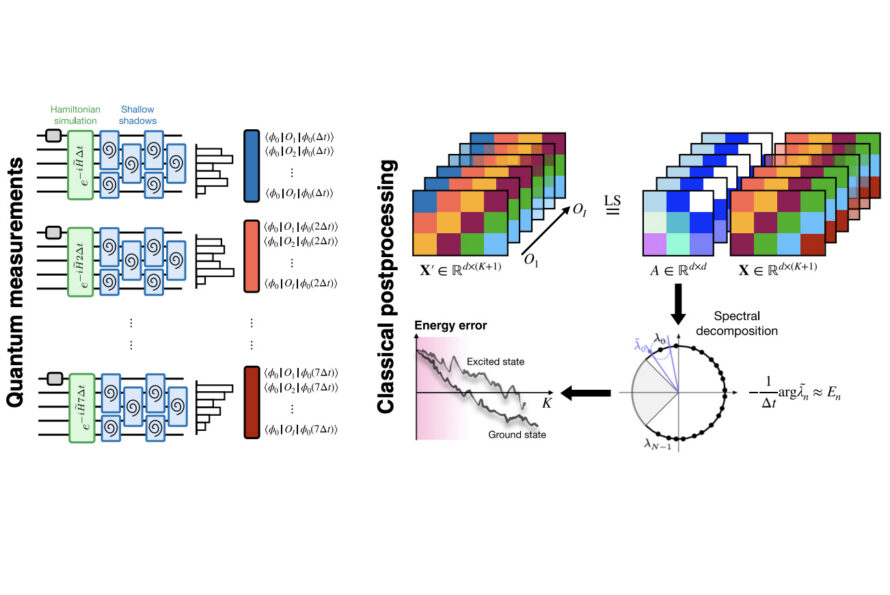
New Hybrid Approach Bypasses Hardware Limits to Unlock Complex Quantum Simulations
New MatterChat Model Helps AI to ‘See’ the Language of Science
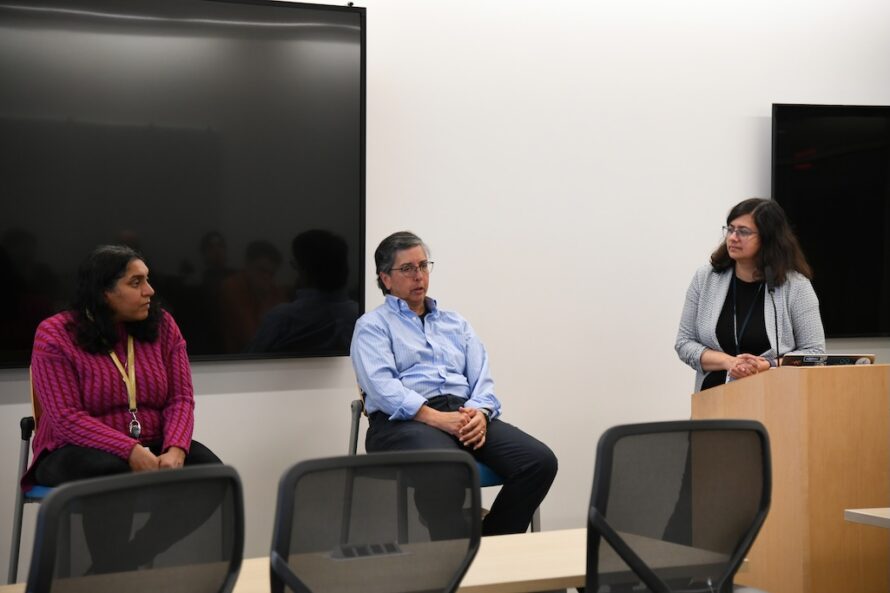
Former NERSC Director, ALD Kathy Yelick Named Director of Berkeley Lab

OmniLearned Foundation Model Shows Promise Across Disciplines
DL4SCI 2026 to Spotlight Discovery through Agentic AI, Foundation Models
Berkeley Lab Takes Major Step Toward Doudna with Delivery of Early Access System, Cech
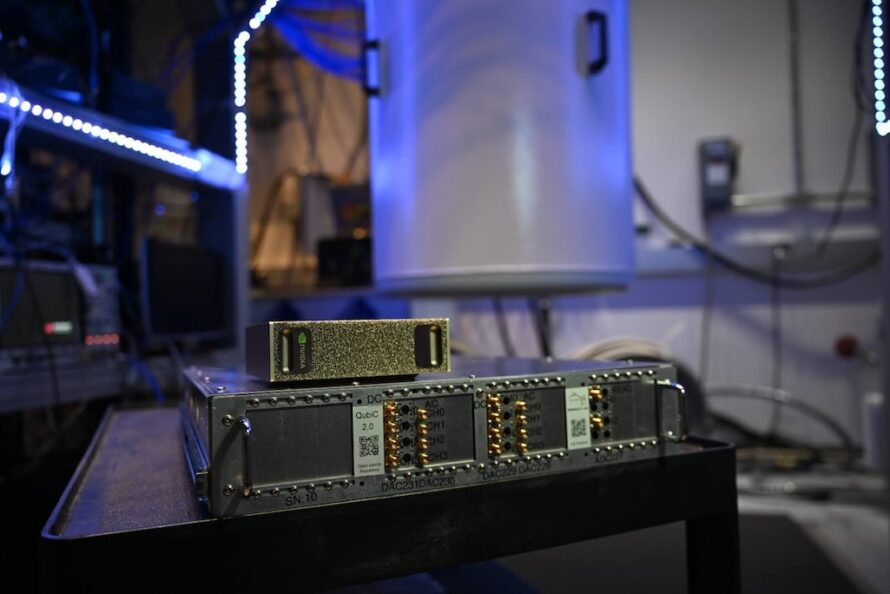
Berkeley Lab and NVIDIA Collaboration Accelerates U.S. Leadership in Hybrid Quantum–Classical Computing
SciData Workshop Brings Community Together To Reflect, Collaborate, And Look Ahead
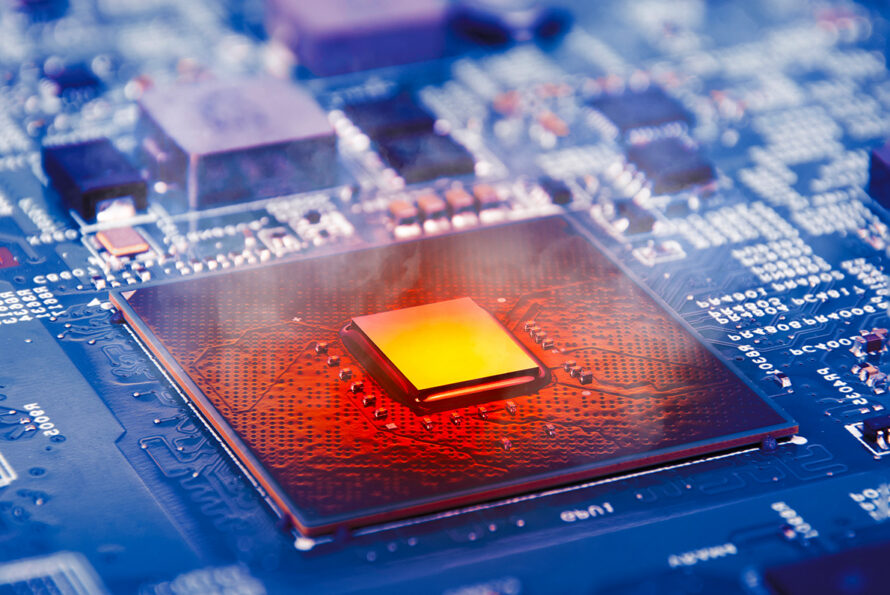
Thermodynamic Computing Advances with Design and Training
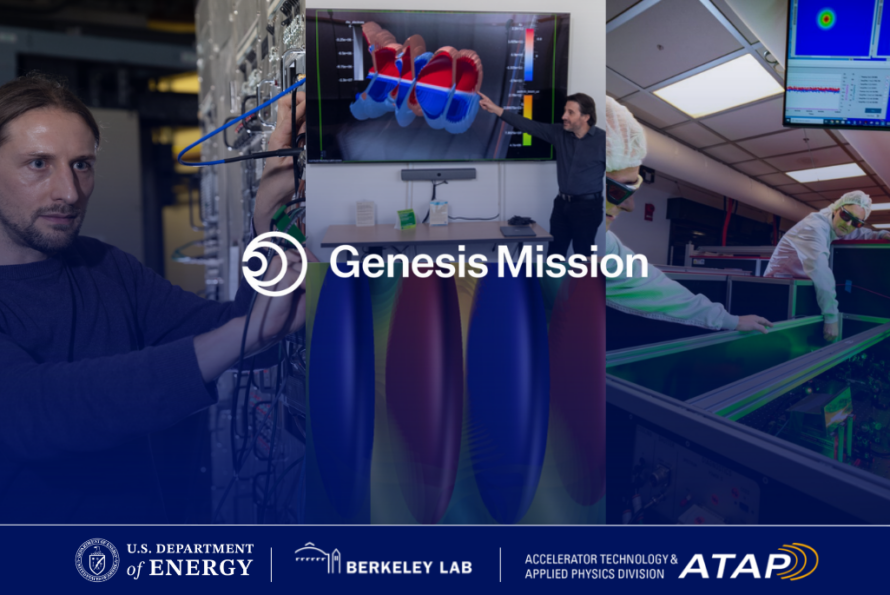
Harnessing AI for Particle Accelerator Innovation
2026 CSA Symposium Helps Researchers Amplify Their Scientific Impact
AMCR’s Aditi Krishnapriyan Receives 2025 Early Career Award