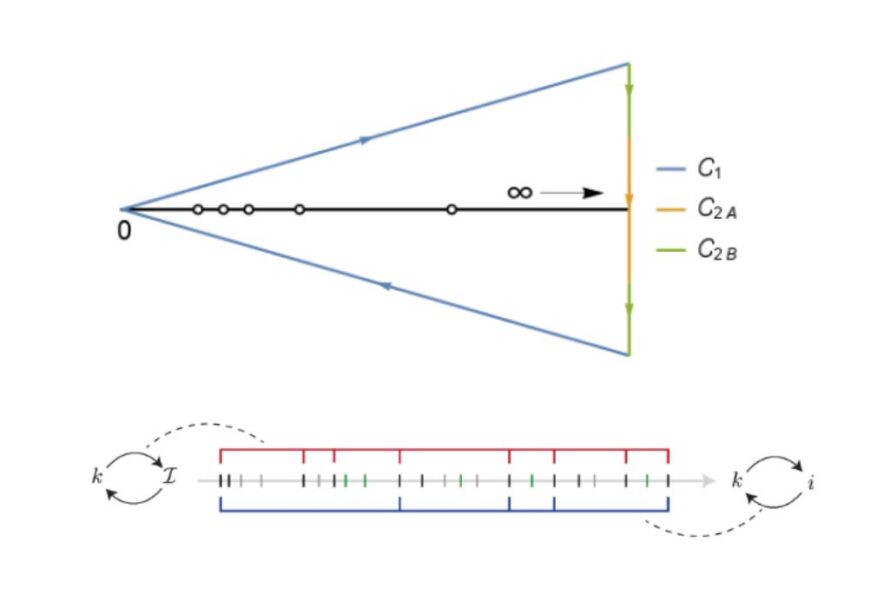
Mathematical Innovation Advances Complex Simulations for Science’s Toughest Problems
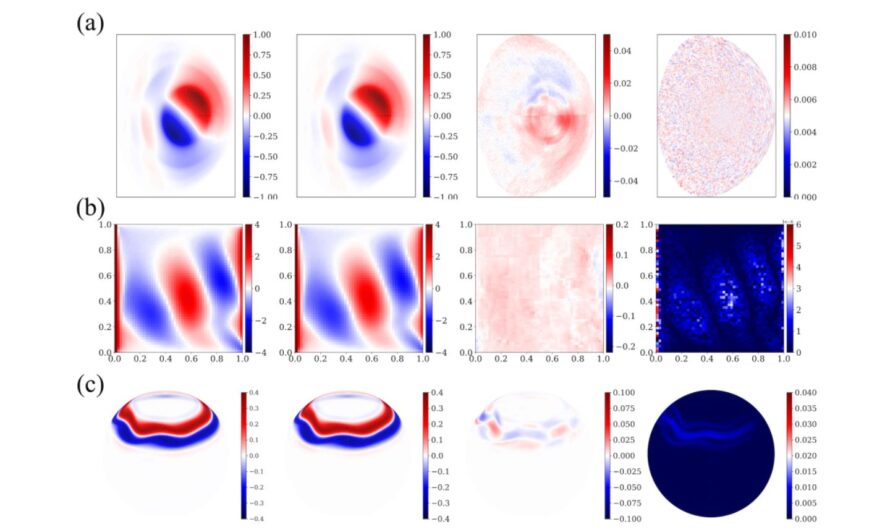
New AI Model Advances Long-Term, Multi-Scale Prediction of Complex Physical Systems
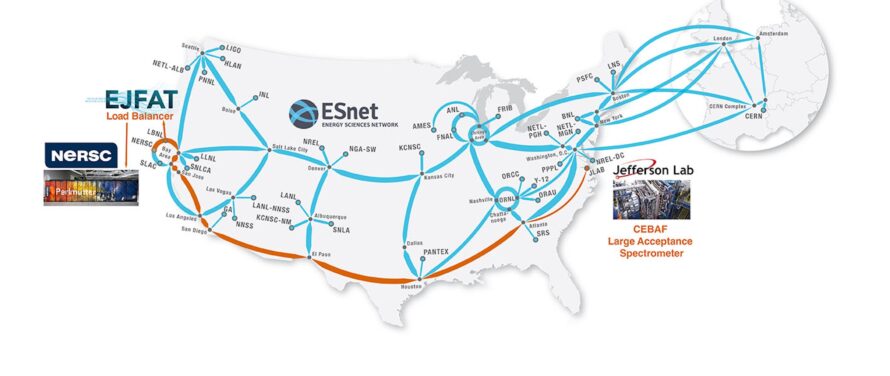
California Streamin’: Jefferson Lab, ESnet Achieve Coast-to-Coast Feed of Real-Time Physics Data
Tropical Cyclones Intensifying Due to Warming Atmosphere

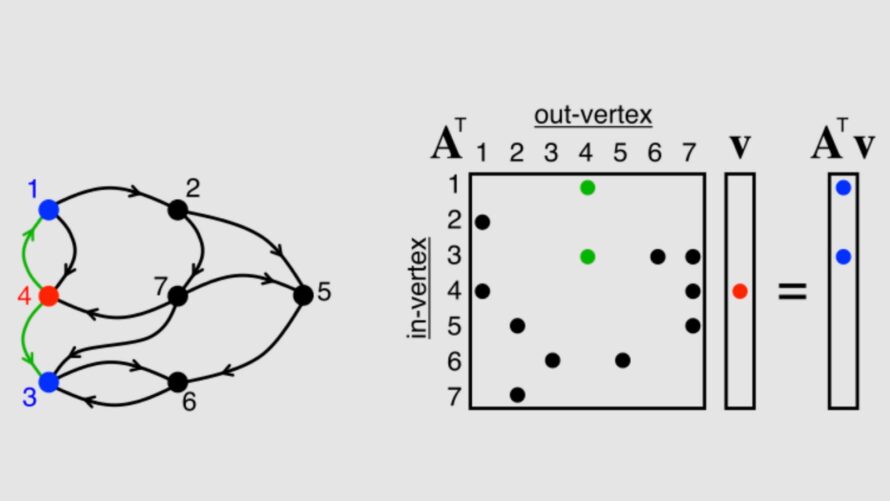
Science Highlight: Specialized Hardware Helps Researchers Quickly Process Sparse Matrices
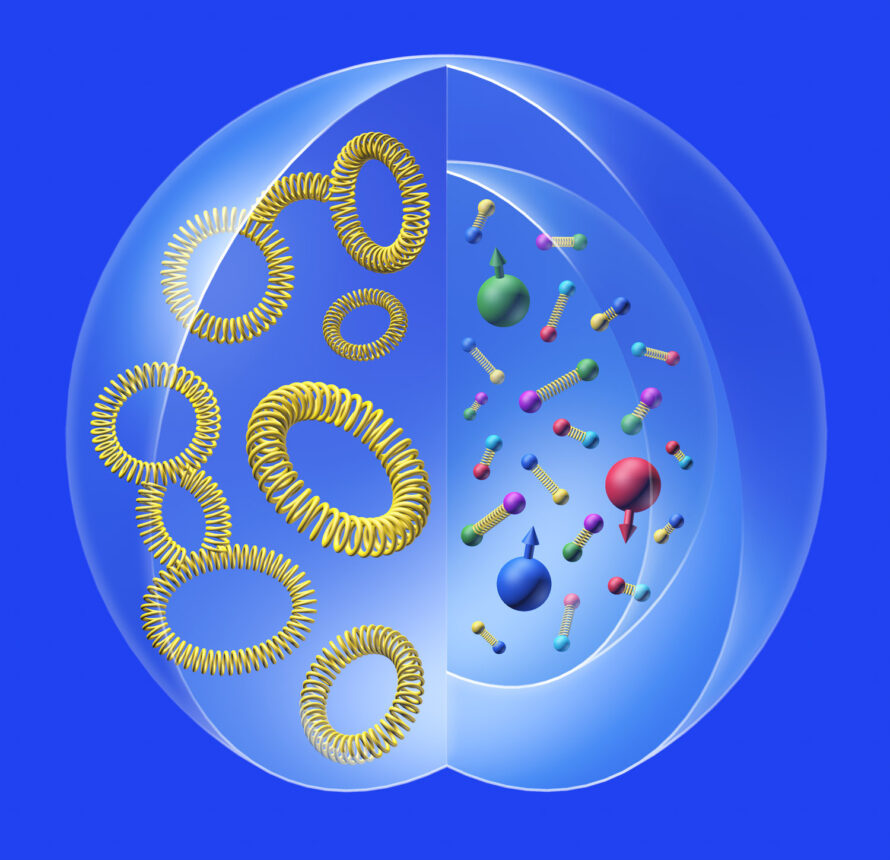
Gravitational Form Factors Illuminate Substructure of the Proton
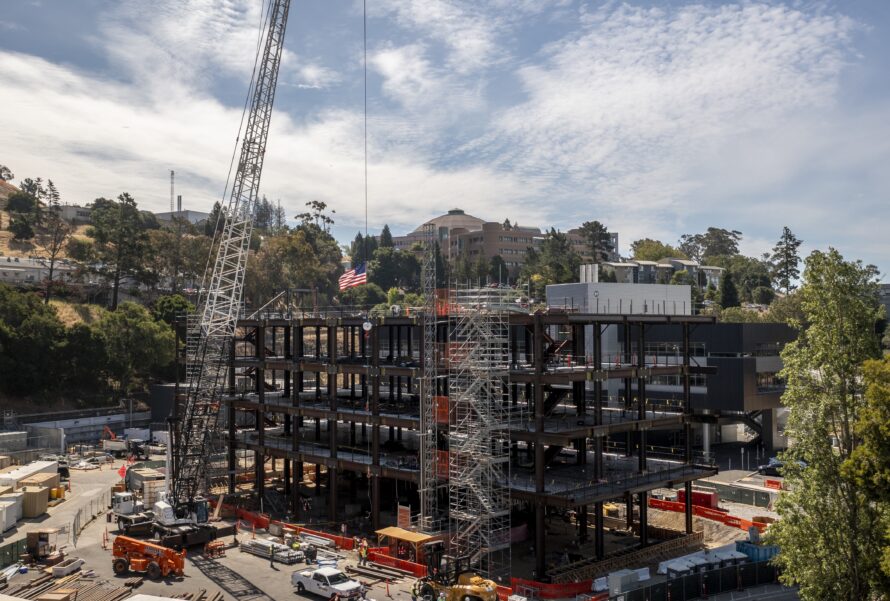
Science Highlight: Perlmutter Supports CO2 Fixation for Carbon-Negative Building Materials
Simulating Plasma, NERSC Systems Enable Efficient Microchip Production

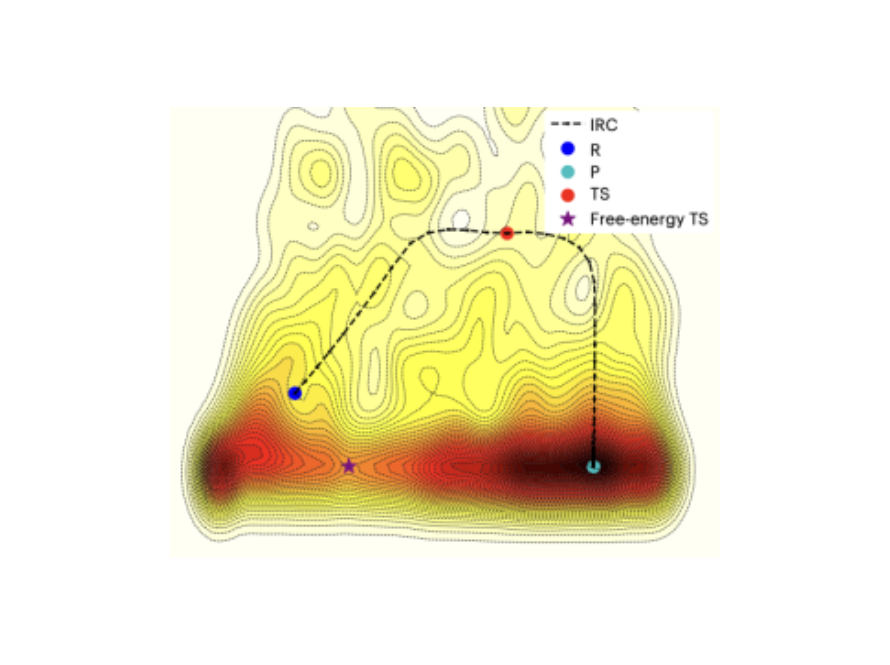
Machine Learning Yields More Efficient Hydrogen Combustion Reactivity Modeling
Cori and Perlmutter Support New Understanding of Reaction Behind Salt-Based Nuclear Reactors
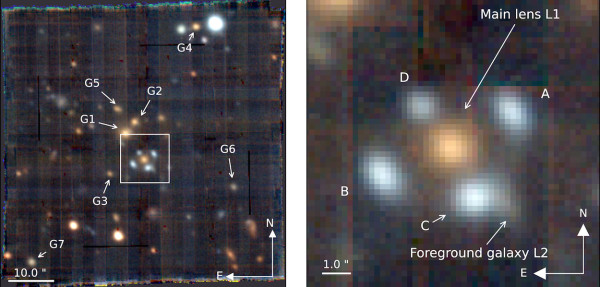
Perlmutter Supports First Gravitational Lensing System Modeled on GPUs
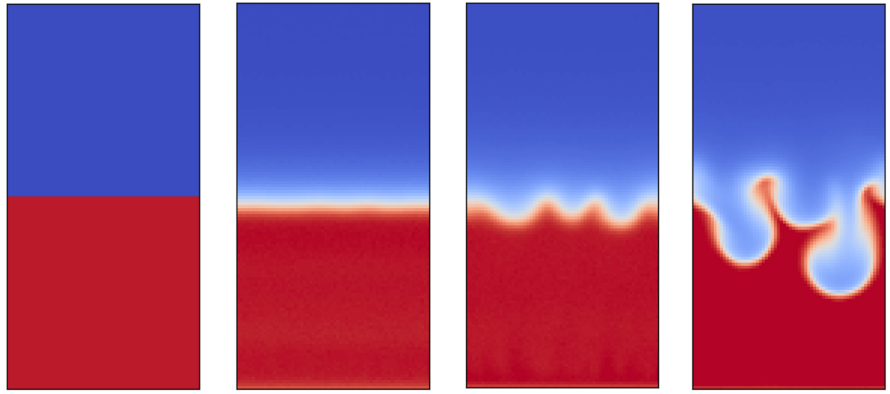
Berkeley Lab’s Novel Method for Modeling Fluids at the Mesoscale